Learning Series: SIGNs, Part 0.5--The One About Why We Care
SIGNs: (S)tochastic Processes, (I)nfinitesimal (G)enerators, & Bayesian (N)etworks

Before launching into the drier aspects of this series, in this post I’ll motivate why we should care about stochastic processes and Bayesian Networks—otherwise I don’t know how sane, happy people just jump into measure theoretic probability and functional analysis for sport. If you’re looking just for the math, skip this post. With that in mind…
Have you ever wondered how a machine could watch people make a sequences of decisions, in any environment, and offer a prediction that could help them avoid worst-case scenarios? Have you ever watched the Schoolhouse Rock episode that defined how most millenials still understand how bills become laws, and then asked, could someone predict which laws will be passed? Have you ever wondered if financial crisis centers actually work in transitioning people out of poverty, and if so, why do some work and some fail? Do these seem like questions I’ve contrived to be disjointedly related for dramatic effect? Does this sound like it could be some hyped up sci-fi bullshit that only large tech companies could afford to do?
If you answered yes to any of these questions, then I would like to walk you through a statistical machine learning modeling approach called Dynamic Bayesian Networks (DBNs).
First let’s break down what this means: here’s a primer on what ‘Bayesian’ refers to—I’d explain it, but alas, this is my blog and I have deemed it beneath me, though with love. Suffice it to say that it is just one way to think about probability and statistics, and that many people in desperate need of more hobbies and people-contact have very strong feelings about choosing this viewpoint versus the Frequentist perspective.
The “Dynamic” part of DBNs just means that we are studying, observing, or looking at objects, people, or things that change over time: imagine the price of stocks day-to-day, how social norms evolve in communities, or even the thermodynamic particle interactions that are slowly leading all life as we know it to the eventual heat death of the universe.
As for “Networks”, this refers to exactly what you’d imagine—a web of things connected by some relationships. Formally (and if you don’t already know it, if I say ‘formally’ or ‘precisely’, I’m about to step into how a mathematician thinks), the networks we’ll be talking about are called directed (a)cyclic graphs.
For example, in a mental health context, maybe I could think of three ‘states’ or ‘sites’ that a single patient’s brain visits day-to-day—in the abstract, these three states could be: ‘depressed’, ‘anxious’, and ‘I’m O.K., I’m just tired’. I could then draw three circles representing these states, and draw arrows for how they’re connected and related to other information: age, height, genetic information, diet, etc. This graph then represents the way in which we believe a phenomenon works—for example, ‘how a person cycles through depression & anxiety depending on context’.
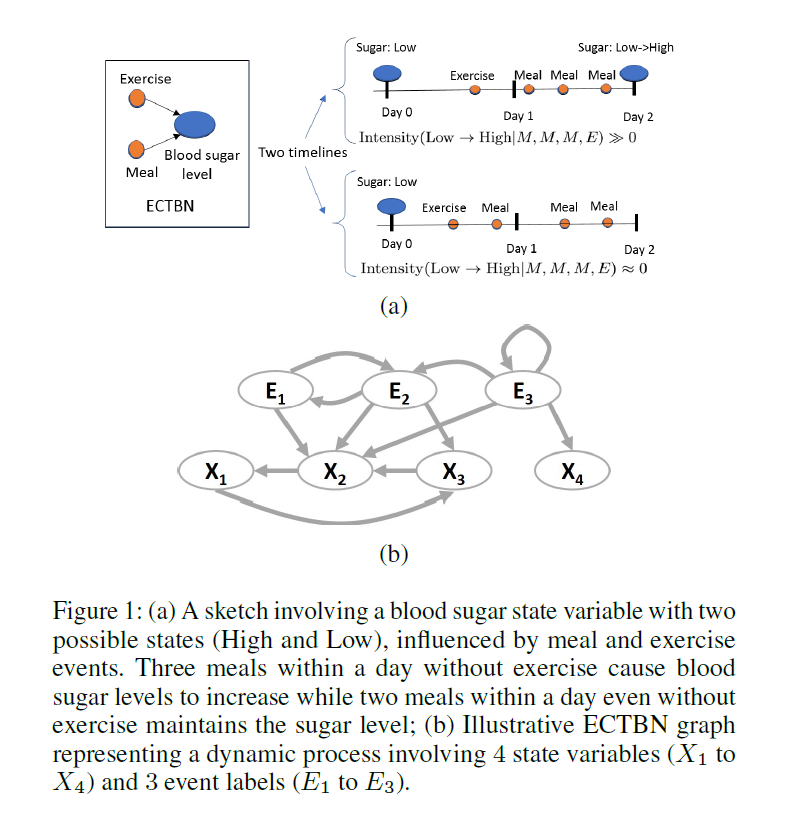
More concretely, I’ll be using the examples borrowed from this paper. Here’s a graphical model describing what a diabetic patient’s ‘state transitions’ might look like:
As you can see, now we can organize time-varying interrelationships and we can start to come up with the idea of a ‘trajectory’ of decisions that we can measure by collecting data.
One caveat you may have in your mind, is, “Well, Conor, that sounds nice on paper, but how do we know the shape of the graph? Or how many nodes or relationships there are? And how can we assert the relationships are causal after that?” This is a great caveat! My answer, like any good statistician will give you, is that we will estimate the structure of the graph from the available data by searching over all the possible ways we could construct a graph, given some states we’re interested in. We will also guarantee that it is a causal relationship using some fancy math, and we will estimate quantities we need for the statistical model based on our graph. So, now, I don’t even need to know how to put the pieces of the graph together—I just need to know what pieces you or a content specialist tells me is important for the phenomenon I’m studying.
As an example of this from the same paper, here is a more sophisticated version of a DBN called an event-driven continuous time Bayesian network (ECTBN), where the authors estimated the causal structure and relationships of the graph from data provided by CityLink Center, an integrated social service provider in Cincinnati. Some information about the data from the authors:
“For our analysis we use the approximately 1400 clients who have had more than 15 total interactions with CityLink out of a total of over 2900 total clients. We consider 6 outcome areas that are tracked through CityLink’s data: education, employment, financial education, transportation, anxiety, and depression. These are dimensions of an individual’s progress in attaining a self-sustainable way out of poverty; details about the levels and their descriptions are in Appendix C. Each of these six outcome areas has between three and six levels. We consider 11 types of services provided by CityLink and its partners, which are treated as
events: 6 of them are group classes/sessions and 5 are one-on-one. The services include group industrial training, group classes on education, employment, financial education, transportation and wellness, as well as one-on-one sessions on employment, wellness, and financial education.”
Note that when the authors say “learned” that this is just machine learning speak for “statistically estimated from the data”.

With a couple examples in hand, now think about how many other things you could describe this way: the process by which bills become laws, how the interdependencies of a country’s resource constraints may influence refugee migration, the management of information technology deployments, or even how the determination of national policies affect economic development indicators. Even better, imagine what you could do if you could assert casaulity about the relationships you estimate in this graph.
In order to do this, however, we need some mathematical and statistical machinery from the study of stochastic processes. In my next post, we’ll start describing how we put together the formal (i.e., mathematical) aspects while sprinkling in some intuition as we go.